")
It’s getting serious and promising! The Cervino project partners have managed to collect enough data and users to start the evaluation process of the data platform. And since there is always room for improvement, the project partners are currently discussing user friendliness, relevant indicators, usefulness, easy handling and durability of the Energy survey tool. Technical issues as for instance the connection of the older version with the new data platform are on the agenda of the involved energy agencies as well. In addition, the expandability of the tool has to be guaranteed in order to ensure further development and sustainable usability. Especially if the participating energy experts and local authorities integrate the platform into their daily work when planning future alpine energy strategies and thereby help the significance of the open-source tool to grow.
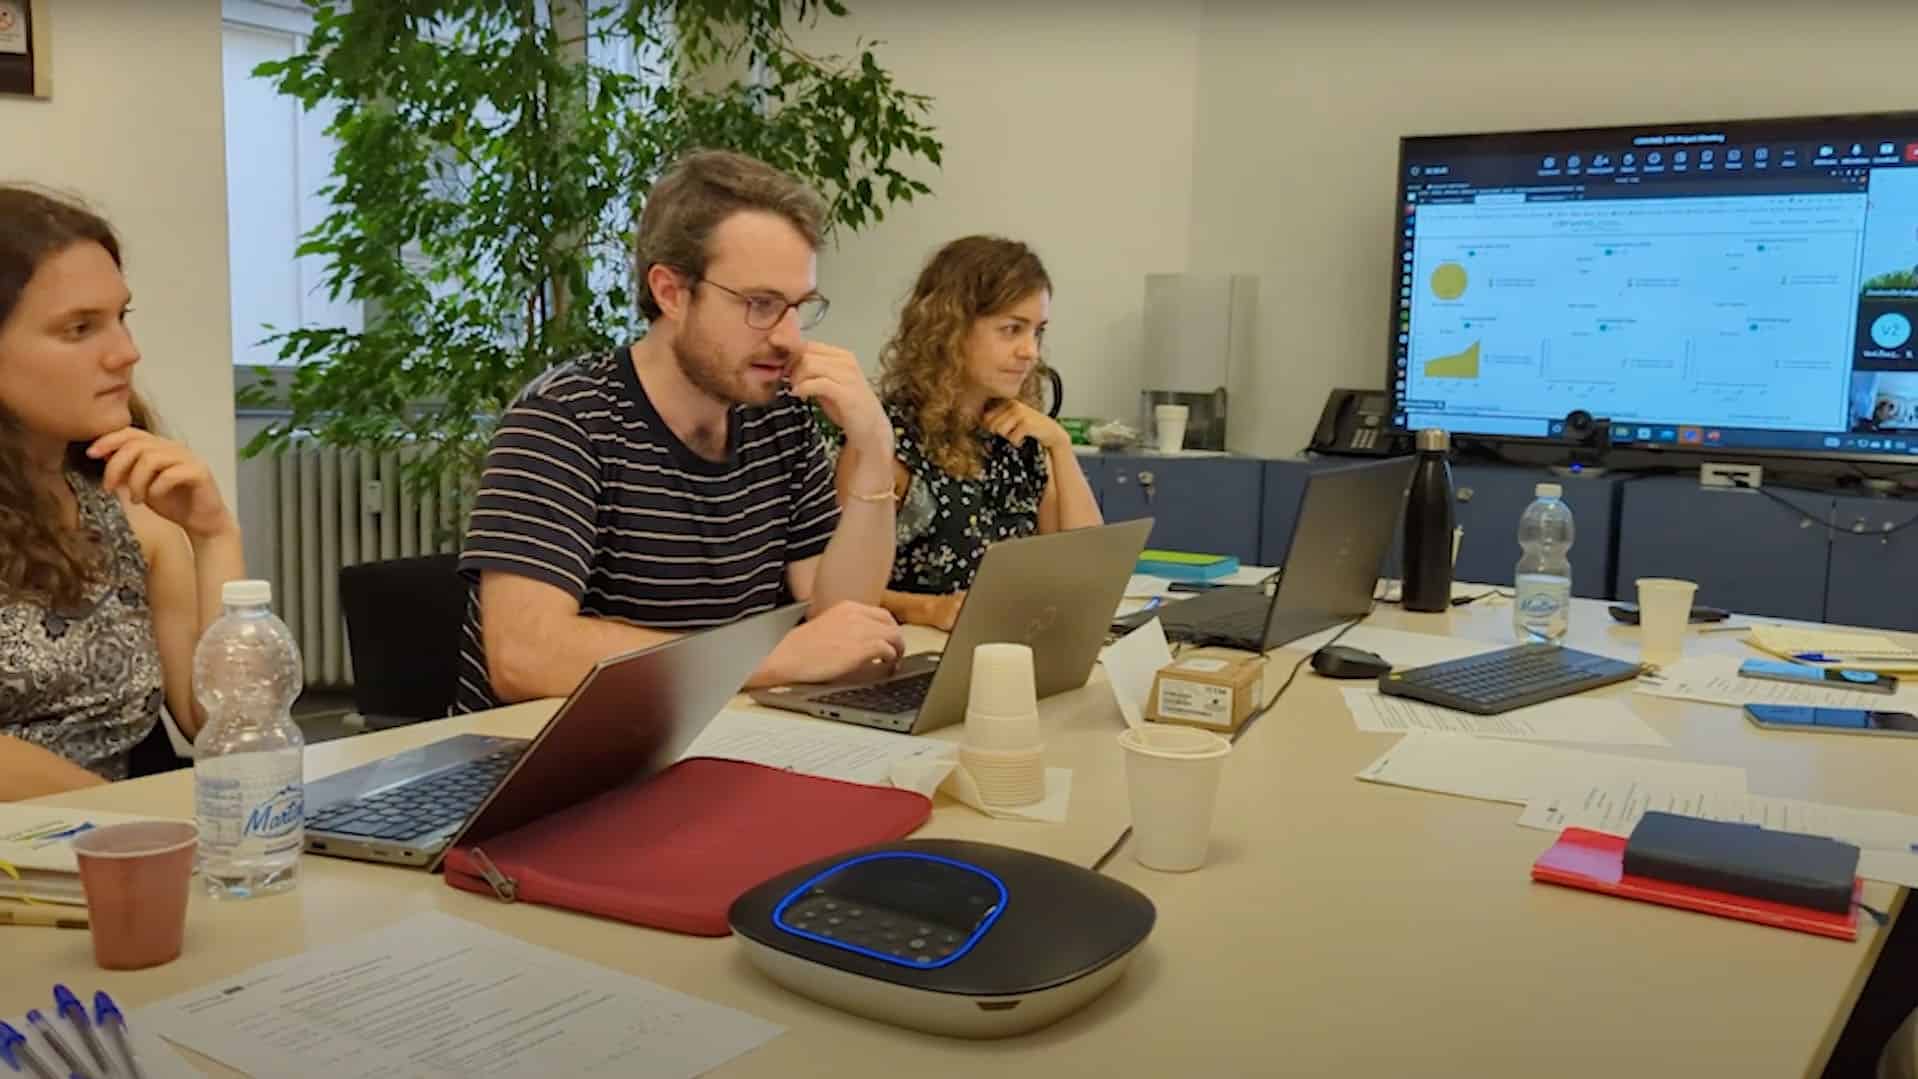
CERVINO soon enters the last quarter of the scheduled project duration. That’s why Stefan Drexlmeier from the civic foundation Energiewende Oberland took the opportunity to ask some of the leading heads of CERVINO about the status quo. During the last project-internal meeting at Genova in September, Valentina d’Alonzo from Eurac gave him a brief description of the energy data collection platform. She underlined her hope that the tool will not be a temporarily deployment. The integration of data into the survey should be an automatic procedure and the regions continuously provide and upload new data when they have updated values. D’Alonzo further emphasized that beside the evaluation of the tool, the next step is to connect the tool with the visualization dashboard in order to have the Cervino energy data platform in its entire form. Therefore, Stefan Drexlmeier initiated a second interview with Matthieu Denoux from AURA-EE who developed the visualization dashboard. Denoux outlined that they have modeled features which will communicate and disseminate the gathered data. The first one is a map enabling the user to visualize every region on NUTS2 level in the EUSALP region and to show various indicators of each of these regions that were created from the data collected.
The second feature is a simple dashboard tool. They created several dashboards on various topics like energy production, energy consumption and so on. The user can choose a region for each of these dashboards to show the data linked to it and to have a quick portrait of the energy transition in each region. He hopes to launch the tool by the end of 2023. Fingers crossed!
You can watch the video interviews via the following links:
Finally, it is important to mention that CERVINO partners are attending some external (EUSALP) meetings to learn from other AG groups and stakeholders about sustainable project organization and beneficial networking. Promoting their own process with the data tool is certainly another motivation. CERVINO will visualize and illustrate the speed of the energy transition within the Alpine region. And that is one of the most important and fundamental type of knowledge when perpetuating and creating a fair-minded and sustainable future.