")
Energy is (actually) invisible. And yet we must manage its production and consumption in such a way that we can achieve the EU’s 2030 climate targets and climate neutrality by 2050 also in the Alps to ensure a future worth living.
In order to achieve this in a targeted manner, within the CERVINO project we
have collected energy data from the Alpine region from 2018 to 2021,
and have now developed a platform on which the data is presented graphically and can be compared with each other: over the course of the years 2018 – 2021, but also between the countries and regions in the Alps.
Energy is now visible after all, and even the energy transition in the Alps can be seen! Which regions are particularly expanding energy production from biomass, wind or photovoltaics, for example? How is energy consumption developing? And with which neighbouring regions or countries might joint energy projects make sense in order to implement the energy transition quickly?
At the beginning of December, Matthieu Denoux and Noémie Bichon from the Auvergne-Rhône-Alpes Energy Environment Agency demonstrated what the CERVINO platform looks like and how energy project planners will soon be able to use it.
Energy data from the EUSALP can be called up on a map for five geographical scales, for example on the subject of “energy production” for
the entire EUSALP region,
an overview of all countries,
an overview of all regions,
but also for each individual country,
or each individual region.
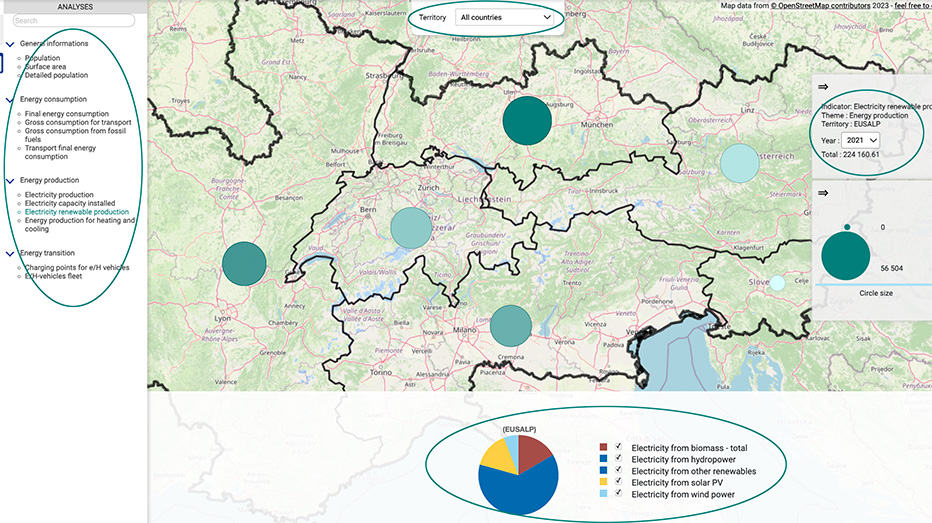
The data is organised into four groups, as shown in the illustration on the left-hand side of the map:
“General information” with general population figures, area and detailed population figures on age distribution and gender.
“Energy consumption” with data on consumption per sector, consumption of fossil fuels and consumption in the transport sector.
“Energy production” with information on the energy production of countries (total from the EUSALP regions) and individual regions, but also specifically on electricity production from renewable energies or energy production for heating and cooling.
Finally, “Energy transition” provides an overview of charging points for electric/hybrid vehicles and data on the number of electric/hybrid vehicles in the EUSALP as a whole region, for countries and regions.
And what can CERVINO’s energy map be used for, for example?
- By selecting different years (in the illustration on the right), users can see the development in the energy sector, for example the expansion of renewable energies.
- By clicking on individual technologies on the map (at the bottom of the illustration), it becomes clear in which countries or regions which technologies are predominant, for example hydropower or photovoltaics.
- The overview of all countries or regions (at the top of the illustration) shows e.g. the distribution of energy production in the Alpine region.
However, if users select an individual region, they can see the details of energy production in this region, for example with biomass, hydropower, etc.
The energy map can be viewed by all interested stakeholders. All users also have access to a general dashboard. It contains graphics on the EUSALP region regarding population figures and area size, energy production and consumption and details on the mobility sector. Anyone who wants to analyse the energy data for their own country or region, for example, or who wants to compare it with other countries and regions, can create their own dashboards using a free login.
Noémie Bichon showed how users can create their own dashboards to gain an overview of a specific energy topic. For example, a dashboard on electromobility in the EUSALP region. After selecting the relevant criteria, such as the number of e-vehicles and charging points, the platform shows the status of e-vehicles and energy consumption for selected years in a specific geographical area, for example in the entire EUSALP area or in an individual region. It is also possible to compare different regions with just one more click. Excel data or a PDF with a graphical representation can be exported for further use of the results. The link to the results page can also be passed on.
The CERVINO platform is currently undergoing final testing by the project team. But even after publication, which is imminent, work will continue to ensure that the content is up to date and new data from regions will be uploaded by project partner EURAC. How you can use the energy data platform for your purposes and also create your own dashboards for analysis will be shown here in a video shortly. Stay tuned!
Find out more about the project CERVINO and the energy data platform on our website www.alpine-space.eu/project/cervino/, LinkedIn, and YouTube
CERVINO alpine energy data platform: https://cervino.eurac.edu