")
„To design efficient and effective policies around energy, we need to have some very good ground around the data – to be sure that we agree on what is available today and towards what goal we should try to move on!” Matthieu Denoux, Auvergne-Rhône-Alpes Regional Energy Environment Agency AURA-EE
The CERVINO Alpine Energy Data Platform is online and ready for use! Based on the latest data, it shows the energy situation in the Alpine region and helps to advance the energy transition.
In an interview with Stefan Drexlmeier (civic foundation Energiewende Oberland), Matthieu Denoux (AURA-EE) explains how you can operate the platform and use it for your own purposes.
Who can use the platform? Anyone who promotes the energy transition in the Alpine region! For example, EUSALP members, ministries, energy agencies, infrastructure operators and companies from the Alpine region. Just start the website and off you go!
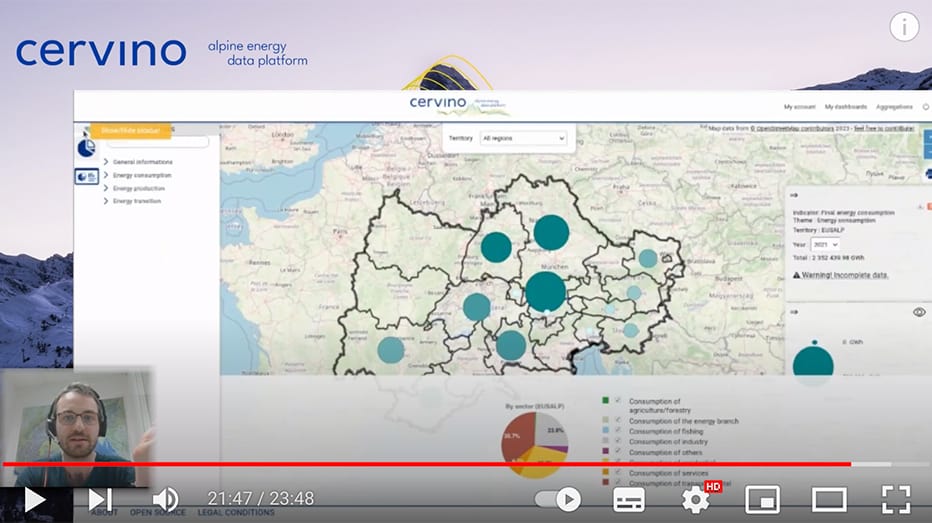
1. Energy data on the map
On the platform, the entire Alpine region is shown on a map.
- As a first step, you can select the region you are interested in – the entire EUSALP region, but also your own, for example.
- In a second step, you can chose the indicators you want to look at, like final energy consumption or production of electricity.
- The result can be seen in two ways. Firstly, in the map view as a circle that shows the total for the selected indicator. Secondly, a diagram below the map displays in detail which sector (e.g. industrial or transport) has which share of the selected indicator.
- The result can be downloaded as an Excel file, e.g. to carry out a more detailed analysis of the raw data used or to look up information on the data sources.
2. The dashboard – graphic display & comparison of regions
In addition to the map, a dashboard is available in which data is displayed as diagrams.
- A general dashboard has already been prepared and visualises many indicators such as socio-economic data, energy production or energy consumption, and can be applied to all geographical levels, from the entire EUSALP region to the individual region. The results can be downloaded as graphics and Excel files or are accessible via the URL.
- It is also possible to compare regions with each other in the dashboard. On the screen, for example, you can see side by side which regions generate energy in which way – perhaps an inspiration for your own sustainable energy policy?
- If you want to analyse certain topics such as energy consumption in the transport sector or similar, you can also create your own dashboards with the corresponding indicators using the “my dashboards” button (login on the top right side). Here, too, it is possible to apply the dashboard to other regions and thus compare the regions with each other.
3. Aggregation tool – combine regions
Finally, Denoux introduces the aggregation tool in the video interview.
- This powerful tool makes it possible to combine and analyse data from several regions.
- This can be useful, for example, when regions have close connections such as shared power lines. The tool can be used, for example, to determine how much electricity they produce together.
- At the same time, it is possible to call up this self-created group of regions in the dashboard and obtain aggregated information for each indicator in the form of graphs.
4. Building strong links and relevant policies – CERVINO’s open data philosophy
CERVINO did not come out of nowhere but is open source! And as expert Matthieu Denoux sets out: “CERVINO is based on another software called Terristory – a French software that is also open source. Part of the philosophy of our CERVINO project is based on this idea of open data. The fact that we want to be able to build strong links between the regions and very relevant policies. We want to have access to all the data that could be useful for public local authorities etc. At the same time, this goes hand in hand with the open source movement, which is why the tool we use to visualise the data is an open source tool, too.”
Try out the new energy data platform! And if you should get lost in the many options, Matthieu Denoux’s tip will help: go back to the map, which is the centrepiece of the platform. From here, you can access dashboards and aggregation again at your leisure. And don’t forget to save. You can reuse and customise your dashboards.
For a guided tour of the CERVINO energy data platform and survey, please take a look at our brief video interviews!
CERVINO Alpine Energy Data Platform: How to use it
- Overview video on features, benefits and own dashboards (9:49)
- Deep-dive interview on how to use the platform (23:49)
The Energy Survey 2023 and the CERVINO data collection platform
- Overview video interview with Valentina D’Alonzo (Eurac) (15:02)
- Deep-dive interview on how to add data to the survey platform with Aaron Estrada (Eurac) (14:17)
CERVINO Alpine Energy Data Platform
CERVINO Energy Survey: https://cervino.eurac.edu
Find out more about the project CERVINO and the energy data platform on our website www.alpine-space.eu/project/cervino/, LinkedIn, and YouTube