")
Authors: Jan Schmieder and Kathrin Schwab (AlpS)
In TranStat’s Living Labs (LL) SNA is applied to identify and analyse relevant stakeholders for transition towards more sustainable forms of tourism and their interactions. SNA is a quantitative and qualitative research method that focuses on the relationships and interactions among individuals, groups, or organizations. It employs graph theory and mathematical models to examine the structure, strength, and patterns of these connections. Furthermore, is enables the study of information flow, influence, and the emergence of structural properties in social networks. SNA helps us understand who the stakeholders in our Living Labs are and how they are collaborating with each other in their networks.
The data is collected by conducting a survey through interviews – by telephone or online. Central questions of the survey are i) Who have you recently worked with in the context of transition towards more sustainable forms of tourism? and ii) Who has influence, expertise or resources that the region uses or could use to enhance transition towards more sustainable forms of tourism? Interview partners were asked to nominate suitable actors and to describe them and the type of cooperation in further questions. The compilation of the questions allows to also cover actors not previously represented in existing LL networks.
It is important to get a broad network and furthermore, to identify new actors depending on the local situation. The results support the formation of core groups that we understand as central and dedicated teams of key stakeholders for the operation and management of the Living Labs. The core group refers to a specific group of individuals or organizations that play a central and pivotal role in the development, operation, and success of the Living Lab initiative.
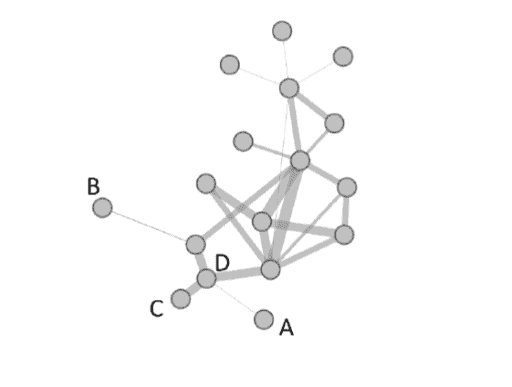
The figure is an example network with 17 actors. Grey nodes represent actors. Actor D is connected to three actors (more central), whereas actor A is connected to only one actor (more preiphereic actor: Grey edges depict the connection between actors. The width of the edges shows the frequency of information flow, e.g. actor A has less frequent information flow with actor D, but actor has has higher information flow with actor C.